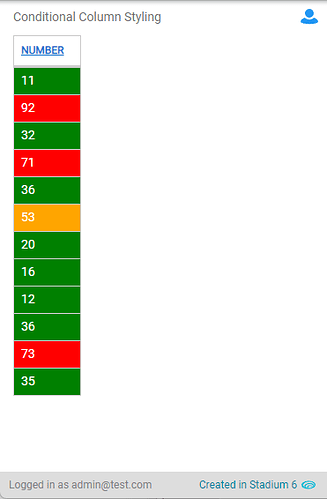
Sometimes you may want to format a DataGrid column according to a numeric value contained in a specific column in that grid, as shown here:
NOTE: Without adjustments these scripts
- work with a column that only displays numbers (no % signs or other values)
- apply the formatting to the last column in the DataGrid (no hidden columns can be after)
Stadium 6
(Scroll down for the Stadium 5 instructions)To achieve this in Stadium 6, we can use the JS MutationObserver interface. The MutationObserver interface provides the ability to watch for changes being made to the DOM tree.
To make this work, add a DataGrid that displays a number in a column and then:
- Add a class to the DataGrid called watched (if you don’t see a Classes property in the DataGrid properties, you need to select your application in the Application Explorer and check “Enable Style Sheet” it in properties)
- In the Page.load script, add a JS action as the first item and paste the following JS:
/*To customise*/
function styleCol(parentEl){

 /*the selector finds the data in the last column of the DataGrid*/
 let cell = parentEl.querySelector("td:last-child div");
 /*for other columns, change the selector, e.g "td:nth-child(1) div"*/

 let cellcontent = parseInt(cell.innerText);

 /*Conditions and class names*/
 if (cellcontent < 40){
  cell.parentElement.classList.add("under40");
 } else if ((cellcontent >= 40) && (cellcontent < 60)){
  cell.parentElement.classList.add("between40and60");
 } else {
  cell.parentElement.classList.add("over60");
 }
}
/*No need to change anything below*/
let el = document.querySelector('.watched table'),
 options = {
      childList: true
    },
    observer = new MutationObserver(mCallback);

function mCallback(mutations) {
  for (let mutation of mutations) {
    if ((mutation.type === 'childList') && (mutation.addedNodes.length > 0)) {
     observer.observe(mutation.addedNodes[0], options);
     if (mutation.addedNodes[0].nodeName == "TR"){
      styleCol(mutation.addedNodes[0]);
     }
    }
  }
}
observer.observe(el, options);
- Open the StyleSheet in the Application Explorer and paste the following CSS
.under40 {
	background-color: green;
	color:white;
}
.between40and60 {
	background-color: orange;
	color:white;
}
.over60 {
	background-color: red;
	color:white;
}
Stadium 5
For Stadium 5 we can follow a similar set of instructions:1. Add a class to the DataGrid called watched (if you don’t see a Classes property in the DataGrid properties, you need to select your application in the Application Explorer and check “Enable Style Sheet” it in properties)
2. In the Page.load script, add a JS action as the last item and paste the following JS:
/*for other columns, change the selector, e.g "td:nth-child(1)"*/
let cells = document.querySelectorAll(".watched table tbody td:last-child");

for (let i=0;i<cells.length;i++){
 let cell = cells[i];
 let cellcontent = cell.innerText;

 /*Conditions and class names*/
 if (cellcontent < 40){
  cell.classList.add("under40");
 } else if ((cellcontent >= 40) && (cellcontent < 60)){
  cell.classList.add("between40and60");
 } else {
  cell.classList.add("over60");
 }
}
- Open the StyleSheet in the Application Explorer and paste the following CSS
.under40 {
	background-color: green;
	color:white;
}
.between40and60 {
	background-color: orange;
	color:white;
}
.over60 {
	background-color: red;
	color:white;
}
